The Central Intelligence Agency (CIA) recently declassified a previously obscure document, identified as “Project Quake-Scan: Seismic Anomaly Mapping,” which includes a detailed cartographic representation of global seismic activity from the mid-20th century. This declassification sheds new light on historical understandings of earthquake distribution and introduces a compelling narrative about the intersection of intelligence gathering and geophysical research. The map, painstakingly rendered and annotated, provides a unique historical snapshot of tectonic stresses and offers insights that continue to resonate within contemporary seismological studies. Its rediscovery has ignited renewed interest in cold war-era intelligence efforts concerning natural phenomena and their potential strategic implications.
The Genesis of Project Quake-Scan
The origins of Project Quake-Scan are deeply embedded in the geopolitical landscape of the Cold War. During this period, both the United States and the Soviet Union engaged in an intense arms race, including the development of sophisticated nuclear weapons. The detection and identification of underground nuclear tests became a paramount concern for intelligence agencies. Seismic monitoring, therefore, transitioned from a purely scientific endeavor to a critical component of national security.
The Strategic Imperative of Seismic Monitoring
The ability to distinguish between natural seismic events and clandestine nuclear explosions was a primary driver for investment in seismological research. Governments poured resources into developing advanced seismograph networks and analytical methodologies. Project Quake-Scan, while ostensibly focusing on mapping natural earthquakes, undoubtedly served a dual purpose, allowing analysts to refine their understanding of background seismic noise and identify anomalous patterns that might indicate man-made events. The map itself, with its highly detailed geological annotations and precise event locations, reflects a commitment to accuracy that went beyond a mere academic exercise.
Interagency Collaboration and Data Acquisition
The creation of the “Lost Map” was not a solitary undertaking by the CIA. Rather, it represents a remarkable instance of interagency collaboration, drawing upon data from various sources. It is understood that information was aggregated from national seismic observatories, military intelligence assets, and potentially even covert listening stations. This confluence of data, often collected under disparate mandates, was then meticulously synthesized by a dedicated team of geophysicists, cartographers, and intelligence analysts within the CIA’s scientific and technical directorates. The sheer volume of raw data processed and integrated into a coherent cartographic product speaks to the concerted effort behind Project Quake-Scan.
Decoding the Cartographic Revelations
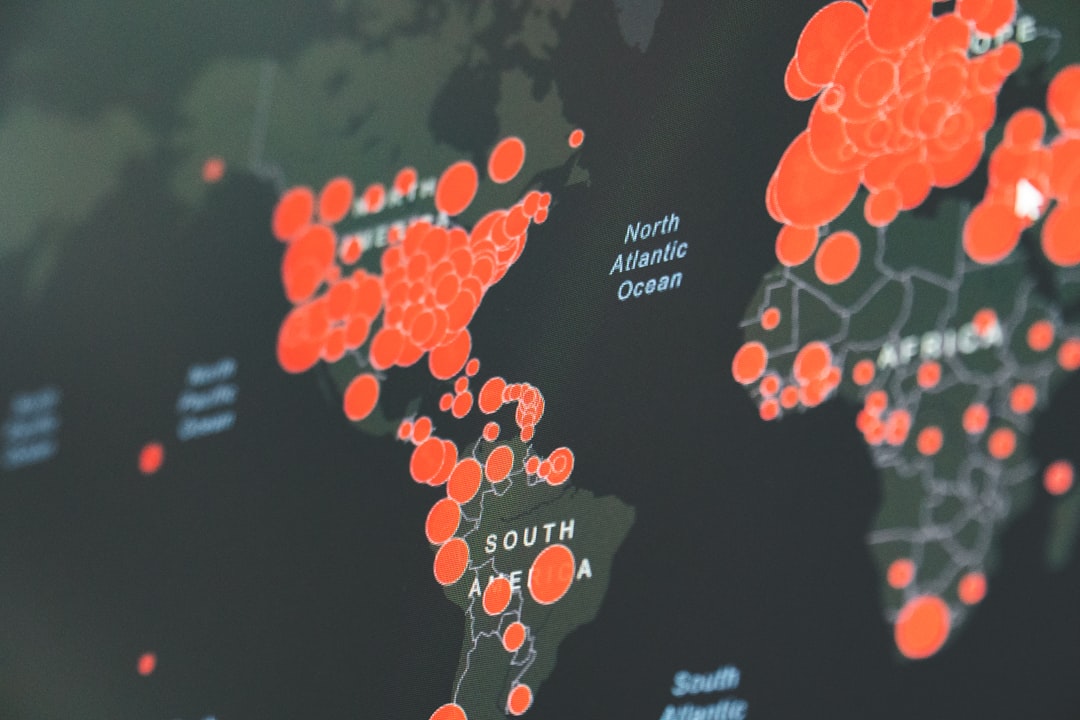
The declassified map is a rich tapestry of geophysical data, painstakingly rendered across the globe. Its most striking feature is the visual emphasis on unprecedented earthquake clusters, some in regions not entirely appreciated for their seismic activity at the time. The map itself serves as a tangible artifact of early attempts to visualize and understand complex geological processes on a global scale.
Unveiling Unanticipated Seismic Zones
One of the most significant revelations from the “Lost Map” is its detailed depiction of several earthquake clusters in areas that, while known to be seismically active, were not previously understood to be centers of such concentrated seismic energy. For instance, the map highlights a pronounced clustering of events along the Eurasian Plate’s boundaries, particularly in regions bordering existing fault lines. This granularity offers a rare historical perspective on stress accumulation and release. Researchers today can compare these historical clusters with contemporary data, offering insights into long-term seismic patterns and potentially identifying areas of increasing or decreasing seismic risk over decades. The map acts as a historical prism, refracting past seismic events onto a canvas of modern understanding.
Implications for Plate Tectonics Theory
While the theory of plate tectonics was gaining widespread acceptance in the scientific community during the mid-20th century, the “Lost Map” provides compelling empirical evidence that reinforces its fundamental tenets. The clearly delineated seismic bands along plate boundaries, especially oceanic trenches and mid-ocean ridges, serve as a visual testament to the dynamic movement of Earth’s lithosphere. The precision with which these clusters align with theoretical plate boundaries suggests a sophisticated understanding of geophysical processes even before comprehensive global seismic networks were fully established. Geologists and seismologists can now scrutinize these historical data points to validate or refine existing models of plate motion and seismic hazard assessment.
Methodologies and Analytical Frameworks
The intellectual and technical rigor employed in creating the “Lost Map” was considerable, particularly given the technological limitations of the era. The project utilized innovative analytical frameworks to synthesize vast amounts of seismic data, demonstrating a forward-thinking approach to geophysical intelligence.
Early Data Triangulation Techniques
The primary method for locating earthquakes in the mid-20th century involved triangulation, a process that relies on measuring the time difference between the arrival of P-waves (compressional waves) and S-waves (shear waves) at multiple seismic stations. The declassified documents accompanying the map describe sophisticated algorithms, likely executed on early computing systems, to process these arrival times and pinpoint earthquake epicenters with a remarkable degree of accuracy for the period. The map’s annotations often include confidence intervals for these locations, indicating a mature understanding of potential errors inherent in the data. This meticulous approach speaks volumes about the project’s scientific aspirations.
Qualitative and Quantitative Data Integration
Beyond raw seismic data, the “Lost Map” also incorporated qualitative geological observations and potentially even anecdotal intelligence reports concerning ground shaking and damage. This integration of diverse data types—ranging from precise instrumental readings to more subjective accounts—suggests a holistic approach to understanding seismic phenomena. The map’s legend, though partially redacted in the declassified version, hints at a multi-layered classification system for seismic events, likely distinguishing between different magnitudes, focal depths, and even potential causal mechanisms. This sophisticated framework demonstrates a comprehensive effort to capture the multifaceted nature of earthquakes.
The Scientific Significance in Retrospect
The declassification of “Project Quake-Scan: Seismic Anomaly Mapping” offers invaluable historical data for contemporary seismological research. It serves as a scientific Rosetta Stone, allowing a deeper understanding of Earth’s seismic history.
Baseline Data for Long-Term Seismic Studies
For seismologists today, the “Lost Map” provides a crucial baseline dataset. Understanding long-term seismic patterns requires historical context, and this map fills a significant gap in the publicly available record. Researchers can now compare the distribution and density of earthquake clusters from the mid-20th century with current seismic activity, enabling the identification of trends, shifts in seismic hazard, and the potential for future large-magnitude events in specific regions. It offers a historical lens through which to view the ebb and flow of tectonic strain, a silent, relentless process that shapes our planet. Just as a physician tracks a patient’s vital signs over decades, seismologists can use this map to track Earth’s pulse across a significant period.
Identifying Persistent Seismic Hazards
The map, by highlighting recurring clusters of seismic activity, implicitly identifies persistent seismic hazards that have remained active over many decades. Regions that showed high earthquake concentrations in the mid-20th century continue to be seismically active today. This reinforces the long-term nature of tectonic processes and the enduring risk posed by certain geological structures. Urban planners and engineers in these areas can gain a deeper appreciation for the historical context of their seismic risk, potentially informing future infrastructure development and emergency preparedness strategies. The map acts as a grim oracle, subtly pointing to areas where the Earth’s crust continues to groan under immense pressure.
Unanswered Questions and Future Research
Despite the invaluable insights provided by the declassified map, several questions remain unanswered, opening avenues for future research and deeper investigation into the historical context of geophysical intelligence. The map, while revealing, is not a complete narrative.
The Purpose of Redactions and Missing Data
A notable aspect of the declassified document is the presence of numerous redactions, particularly in accompanying analytical reports and certain cartographic annotations. These redactions inevitably spark curiosity: what information was deemed too sensitive for public release, even decades later? Were these redactions related to specific intelligence sources, advanced detection methodologies, or perhaps even highly speculative conclusions that the agency wished to keep under wraps? Future research could involve attempts to deduce the nature of this redacted information, potentially through comparative analysis with other declassified documents from the period or through the application of advanced textual analysis techniques. The blank spaces on the page are as intriguing as the visible text, tantalizing us with what remains hidden.
The Human Element: Analysts and Their Interpretations
The declassified map is a product of human endeavor, involving numerous intelligence analysts, geophysicists, and cartographers. Little is known about the individuals who painstakingly compiled and interpreted this vast amount of data. What were their backgrounds? What challenges did they face in synthesizing disparate data points? Did internal debates or differing interpretations influence the final cartographic representation? Exploring the human element behind Project Quake-Scan could offer valuable insights into the methodologies and biases inherent in intelligence analysis of the period. Understanding the minds that created this map is crucial to fully appreciate its nuances and limitations. It is a canvas painted by individuals, and understanding the artist enhances our appreciation of the art.
Potential for Further Declassifications
The declassification of “Project Quake-Scan” raises the tantalizing possibility of further declassifications of related documents. Was this map part of a larger series of geophysical intelligence reports? Are there other maps depicting different natural phenomena, such as volcanic activity or oceanographic currents, developed with similar rigor and strategic intent? Researchers and the public alike might advocate for the declassification of additional materials, which could further enrich our understanding of Cold War-era intelligence gathering, not just in its strategic and political dimensions, but also in its surprising engagement with pure scientific inquiry. The “Lost Map” may well be just one piece of a much larger, still-hidden mosaic.
In conclusion, the declassification of the CIA’s “Lost Map” represents a significant contribution to both seismological history and the annals of intelligence studies. It stands as a testament to the scientific acumen deployed during a period of intense geopolitical competition, offering a unique window into past tectonic dynamics and serving as a valuable resource for contemporary scientific inquiry. Researchers and enthusiasts alike are encouraged to delve into this remarkable historical document, for within its intricate lines and annotations lie answers, and perhaps even more questions, about our dynamic planet.
FAQs
What is the CIA declassified lost map related to earthquake clusters?
The CIA declassified lost map refers to a previously undisclosed document or map that the Central Intelligence Agency released, which shows detailed information about clusters of earthquakes in specific geographic regions. This map provides insights into seismic activity patterns that were once classified.
Why was the earthquake clusters map classified by the CIA?
The map was likely classified due to national security concerns, as understanding seismic activity can have strategic implications, including the assessment of natural disaster risks near sensitive installations or infrastructure. The classification helped control the dissemination of potentially sensitive geological data.
What information does the declassified map reveal about earthquake clusters?
The map reveals the locations, frequency, and intensity of earthquake clusters over a certain period. It highlights areas with heightened seismic activity, which can be critical for scientific research, disaster preparedness, and understanding tectonic movements.
How can the public and researchers benefit from the declassification of this map?
The declassification allows scientists, emergency planners, and the general public to access valuable data that can improve earthquake prediction models, enhance preparedness strategies, and increase awareness of seismic risks in various regions.
Are there any limitations or concerns regarding the accuracy of the declassified earthquake clusters map?
While the map provides important historical data, it may have limitations due to the technology and data collection methods available at the time it was created. Additionally, some information might still be redacted or incomplete, so it should be used in conjunction with current seismic data for comprehensive analysis.